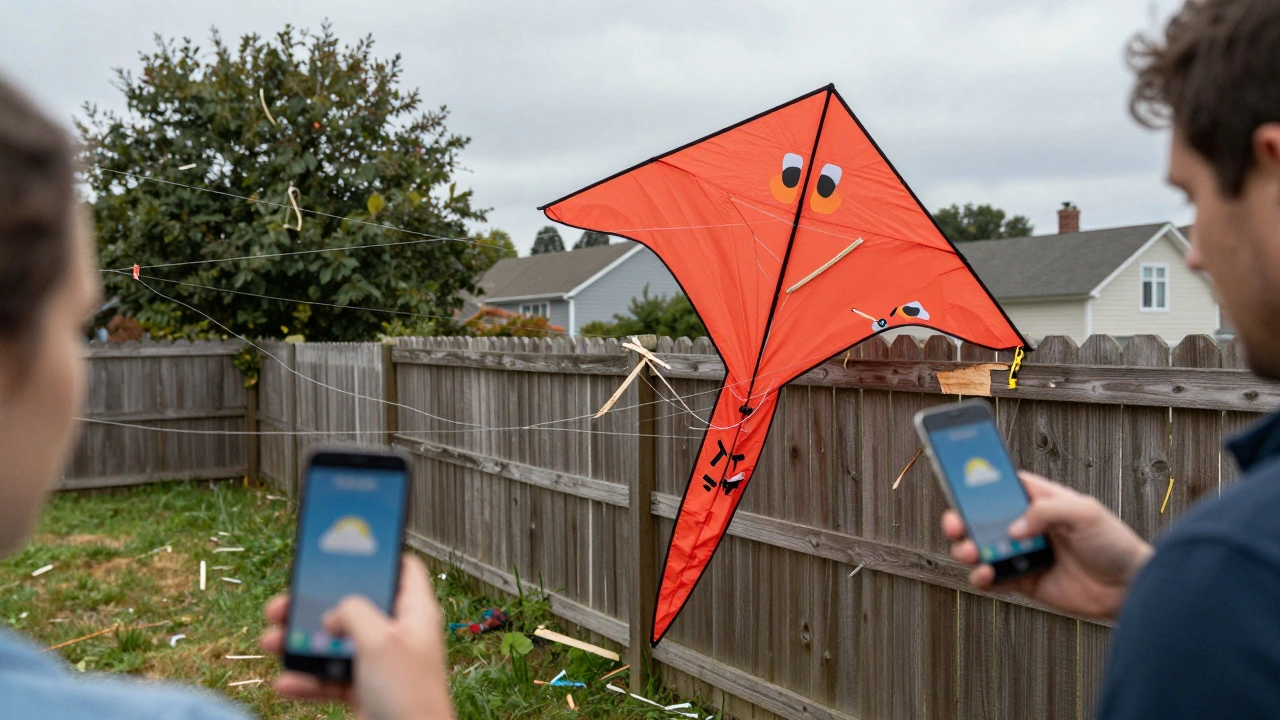
There is nothing worse than launching a beautiful delta kite that relies on steady airflow to maintain lift and stability into a wall of chaotic air. You pull the line, the kite stalls, spins out of control, and crashes into your neighbor’s fence. It happens because you guessed the wind was good enough. Guessing is how kites get destroyed. That is where kite weather labs come in-not as a scientific facility, but as your personal system for measuring, recording, and understanding the invisible force that keeps you airborne.
I live in Portland, Oregon, where the wind changes direction every twenty minutes depending on whether it is coming off the Willamette River or pushing down from the Cascades. If I fly without checking my own data, I am just hoping for the best. By building a simple weather station around my flying routine, I turned random crashes into predictable flight paths. This guide will show you how to set up your own measurement system, record those tricky gusts, and read charts so you know exactly when to launch.
Why Standard Forecasts Fail Kite Flyers
You check the app on your phone. It says "10 mph winds." You head to the beach. The moment you step onto the sand, the wind hits you at 25 mph, then drops to zero, then spikes again. Why does this happen? Standard weather forecasts are built for agriculture, aviation, and general public safety. They use large grid models that average conditions over square miles. A weather forecast model that predicts atmospheric conditions using computer simulations of fluid dynamics does not care about the micro-turbulence created by a dune or a tree line fifty feet away.
Kites are sensitive instruments. A sport kite needs a specific range-usually between 8 and 15 mph-to perform tricks. A large foil kite might need 20+ mph to stay aloft. The difference between a smooth glide and a crash is often just two or three miles per hour. When you rely on generic forecasts, you miss the texture of the wind. You need local, real-time data. This is the core purpose of your personal weather lab: to bridge the gap between broad predictions and ground-level reality.
- Average vs. Instantaneous: Apps show averages. Kites react to instantaneous bursts.
- Elevation Differences: Forecast stations are often inland; you are likely near water or open fields.
- Terrain Effects: Hills and buildings create eddies that standard maps ignore.
Measuring Wind: Tools Beyond the Smartphone
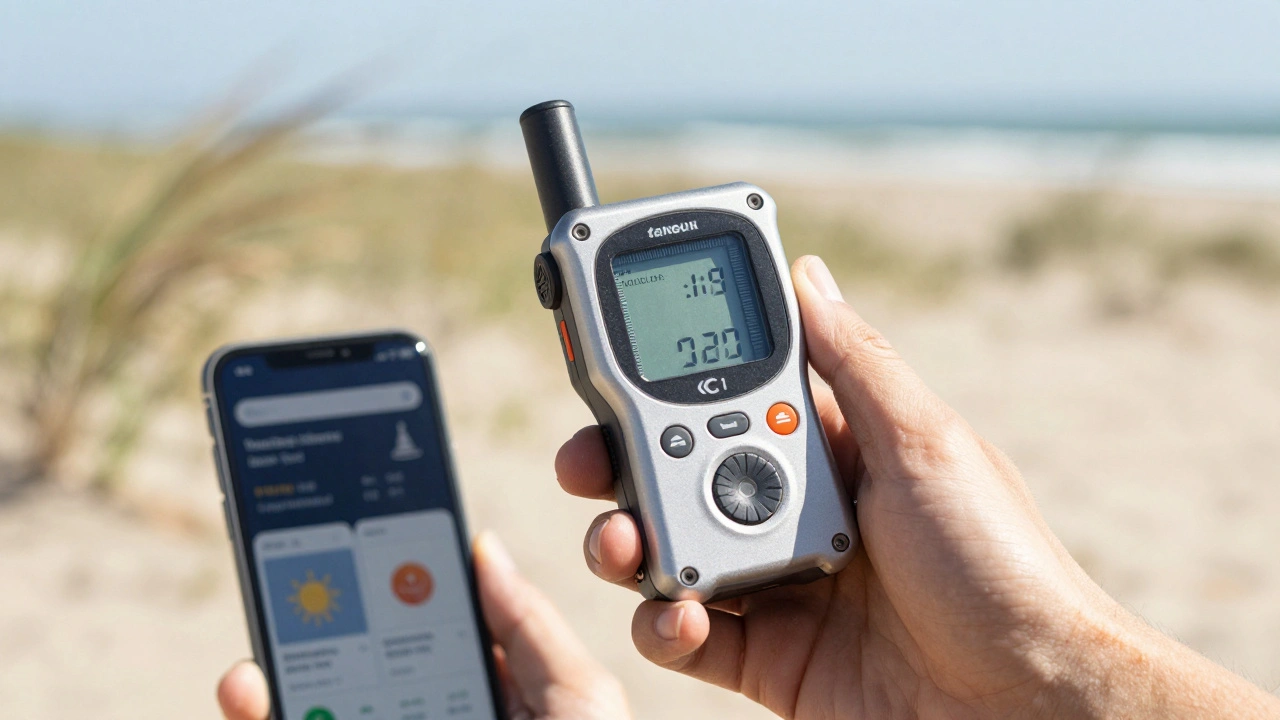
To build a reliable weather lab, you need hardware. Your smartphone has sensors, but they are designed for location services and battery efficiency, not aerodynamic precision. For accurate measurements, you need an anemometer that measures wind speed using rotating cups or propellers connected to a digital display. There are two main types you should consider: handheld cup anemometers and ultrasonic sensors.
Cup anemometers are the workhorse of kite flying. They are rugged, inexpensive, and give you a direct reading of wind speed. Look for one with a high sampling rate. Cheap models update once per second, which is too slow for gusty conditions. You want a device that samples ten times per second. This allows you to see the rapid fluctuations that cause a kite to jerk or stall. Place the sensor at the same height where your kite will fly-usually five to ten feet off the ground for most recreational lines.
Ultrasonic anemometers offer directional data, telling you not just how fast the wind is blowing, but from which angle. This is crucial for understanding crosswinds. If the wind shifts from the north to the northeast while you are flying, your kite’s behavior will change dramatically. Directional awareness helps you position yourself correctly before you even launch. While more expensive, these tools provide the depth of data needed for serious pilots who want to master complex maneuvers.
| Tool Type | Best Use Case | Accuracy | Cost Range |
|---|---|---|---|
| Handheld Cup Anemometer | Quick checks, casual flying | ±3% error margin | $20 - $60 |
| Digital Ultrasonic Sensor | Directional analysis, pro flying | ±1% error margin | $150 - $400 |
| Smartphone App | Rough estimation only | High variability | Free |
Recording Gusts: The Hidden Danger
Wind speed is a number. Gusts are events. A sustained wind of 12 mph feels like a gentle breeze. A gust that jumps from 12 to 25 mph in half a second can snap a line or tear a canopy. Most people ignore gusts because they are hard to predict. However, recording them is the single most important part of your weather lab.
When you measure wind, do not just note the average. Note the peak. Use a notebook or a simple logging app to record three values every time you check the conditions: the minimum, the average, and the maximum gust. Over time, you will start to see patterns. In Portland, I noticed that gusts tend to spike in the early afternoon as the sun heats the urban core, creating thermal updrafts that mix with the river breeze. Knowing this pattern means I schedule my hardest flights for the morning, when the air is smoother.
Gust factor-the ratio of the highest gust to the average wind-is a key metric. If your average is 10 mph and your gusts hit 20 mph, your gust factor is 2.0. A gust factor above 1.5 usually indicates turbulent air that is difficult to control. For beginners, a gust factor below 1.2 is ideal. It means the wind is consistent. Recording these numbers turns subjective feelings like "it's windy" into objective data points that dictate your strategy.
Reading Kite Charts: Visualizing the Invisible
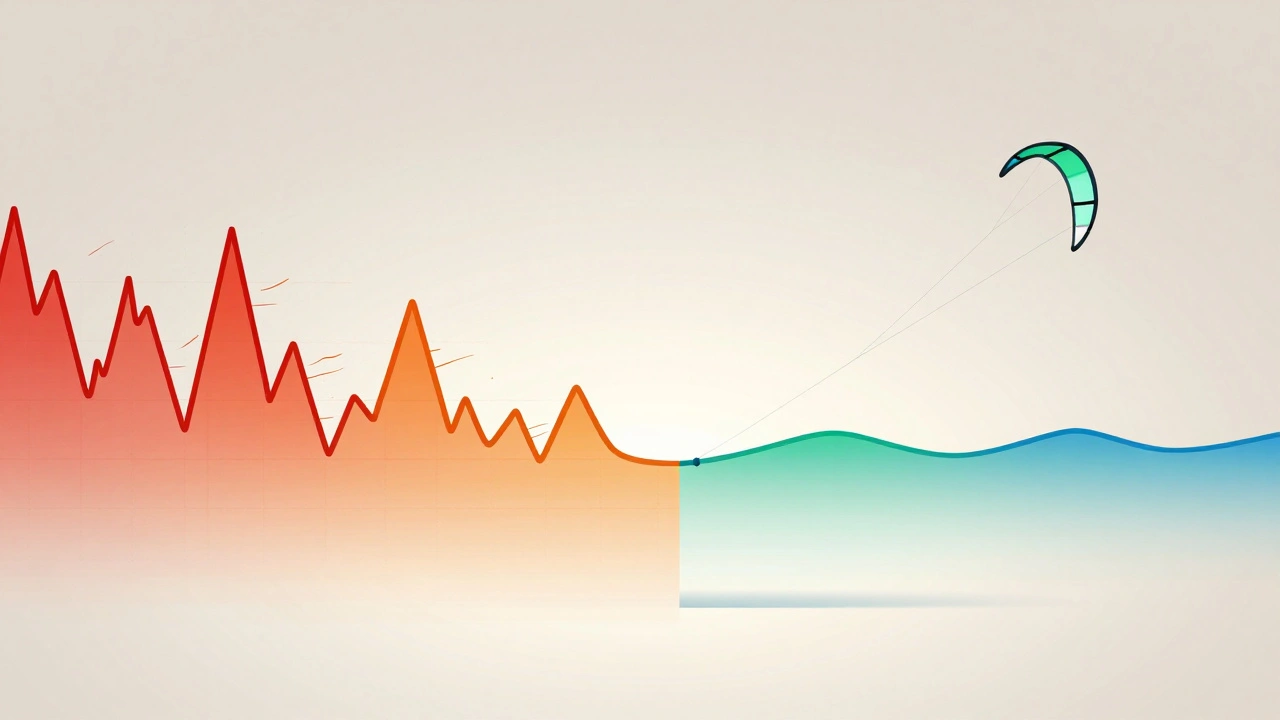
Data is useless if you cannot interpret it quickly. This is where charts come in. You do not need complex software. A simple line graph plotted on graph paper or a spreadsheet can reveal trends that raw numbers hide. Create a chart with time on the horizontal axis and wind speed on the vertical axis. Plot your average wind speed as a solid line and your gust peaks as individual dots above the line.
Look for the shape of the curve. A flat line means stable conditions, perfect for learning new tricks. A jagged line with high peaks means chaotic energy, better for power kites or slacklining. A downward slope indicates dying wind, signaling it is time to pack up before the kite falls. These visual cues allow you to make split-second decisions during flight. If you see the trend dropping, you can move to a higher elevation or switch to a smaller kite to maintain lift.
Advanced flyers also track wind direction on separate charts. By overlaying speed and direction, you can identify shifting fronts. A sudden shift in direction often precedes a drop in speed or a storm. Recognizing these signs early keeps you safe and protects your equipment. Charts transform scattered data into a narrative of the day’s weather, giving you a roadmap for your session.
Building Your Personal Weather Station
You do not need a professional setup to start. Begin with a basic cup anemometer and a notebook. Go to your flying spot at different times of the day for a week. Record the wind speed, gusts, and direction. Note the sky conditions-are there clouds? Is it raining? This baseline data will teach you more about your local environment than any app ever could.
As you become more serious, upgrade your tools. Add a digital logger that stores data automatically. Connect it to a tablet or phone via Bluetooth. Use free apps to visualize the data in real-time. Share your findings with other local flyers. Community data pools help everyone understand regional patterns. In many cities, groups of kite enthusiasts maintain shared logs that predict daily windows for optimal flying.
Remember, the goal is not perfection. It is awareness. Every measurement you take reduces uncertainty. Every gust you record saves you from a potential crash. Your weather lab is an extension of your skill set, allowing you to fly smarter, safer, and longer. Start small, stay consistent, and let the data guide your next launch.
What is the best wind speed for flying a standard delta kite?
Most standard delta kites fly well in winds ranging from 8 to 15 mph. Below 8 mph, they may struggle to gain altitude. Above 15 mph, they can become difficult to control due to excessive tension on the lines. Always check your specific kite manufacturer recommendations for precise limits.
How do I calculate the gust factor for my flying site?
Divide the highest recorded gust speed by the average wind speed. For example, if the average wind is 10 mph and the strongest gust reaches 20 mph, the gust factor is 2.0 (20 / 10). A lower gust factor indicates smoother, more predictable air conditions.
Can I use my smartphone to measure wind accurately?
Smartphones can provide rough estimates using barometric pressure and GPS data, but they lack the precision needed for safe kite flying. Dedicated anemometers offer far superior accuracy and response times, making them essential for detecting dangerous gusts and turbulence.
Why is wind direction important for kite flying?
Wind direction determines where you should stand relative to obstacles and other flyers. Shifting winds can cause kites to drift into unsafe areas or lose lift unexpectedly. Tracking direction helps you anticipate changes and adjust your stance or kite type accordingly.
How often should I update my personal weather logs?
Update your logs every time you visit a flying site, ideally multiple times a day across different seasons. Consistent tracking reveals long-term patterns and seasonal variations, helping you plan future sessions with greater confidence and safety.